
Traceability in a serverless Azure architecture has been a pain point of application development teams for years. Without it, you have no idea what’s going on under the hood and are left with aimless troubleshooting when something does go wrong. It’s a complex problem but below is a valuable solution we have created that you can use and implement into your event driven system.
Log Tracing in Multi-hop Azure Functions Applications Triggered by Events
Traditional application development has grown to the point where execution, memory, and IO are seamlessly integrated and access and observation via debugging and logging are taken for granted. IDEs make investigation of an application possible down to the smallest detail. Cloud applications are in some ways a repeat of the earliest days of computing, where once again we must think carefully about execution, memory, and IO but now as compute resources, event buses, and cosmos containers. We have yet to discover the answer to the question ‘how do we debug this (virtual) computer?’ as we have with traditional applications.
This document describes a solution to track application workflow from end to end, given a cloud architecture where an azure function is triggered by an event hub which in turn emits a new event that triggers another function(and so on for any arbitrary number of hops). The logging is done via application insights and some supplementary logic within the functions as well as additional cloud resources to pass along the desired information.
The solution is broken down into modular components describing the technique for single aspects of the application, which can be extended and reused to fit any particular architecture.
By default, there is nothing to relate separate requests for stitching the full workflow together. Moreover, Azure does not provide integrated logging to application insights for results of Streaming Analytics Jobs. Azure tends to prefer explicit provisioning of existing resource types to enable deeper logging. Instead of configuring features within a Streaming Analytics resource, additional resources are wired up to it for logging in the same pattern as the regular event driven architecture itself. So along side event hubs and functions serving the data from business logic, there will be event hubs and functions for the metadata required for logging and tracing requests.
Architecture Requirements
- Azure Functions Application with at least two business logic functions(F1_filtered, F2_filtered…), the first emits an event back out and both are triggered by separate events. Additionally, for each business logic function, there will be a logging function counterpart(F1_logging, F2_logging…).
- Event hubs to trigger the functions with streaming analytics jobs filtering the incoming events(E1, S1, E1_filtered, E1_logged, E2, S2, E2_filtered, E2_logged….)
- Application insights for logging of the events incoming to the functions and emitted out
Streaming Analytics Job Event Tracking
The first workflow to trace in an event driven application is the event coming in and any filtering, deduplication, or manipulation that is done to it by a Streaming Analytics Job. The following solution provides developers a way to track this process in application insights.
Event
Consider the following event using Azure’s grid event model:
public class GridEvent<T>
{
     public string Id { get; set; }
     public string Subject { get; set; }
     public string EventType { get; set; }
     public string EventTime { get; set; }
     public T Data { get; set; }
     public string DataVersion { get; set; }
     public string MetadataVersion { get; set; }
     public string Topic { get; set; }
}
Suppose an event of this type is sent to the E1 event hub, which is then sent as input to the S1 Streaming Analytics Job. To demonstrate tracing the process of dropping requests, the streaming analytics job S1 would have a query that looks like this:
-- Pass through some events to the filtered event hub
SELECT *
WHERE subject = 'some filter criteria'
INTO [asaout-E1_filtered]
FROM [asainp-E1]
-- Pass through all events to logging
SELECT *
INTO [asaout-E1_logged]
FROM [asainp-E1]
This will fork the incoming events into two separate outgoing event hubs. asaout-E1_filtered sends events to E1_filtered event hub. These events have been deduplicated, filtered, and even possibly changed(the wrapping GridEvent structure should stay the same, but changes to the data are acceptable). asaout-E1_logged sends all incoming events back out as is to E1_logged.
Functions
Next, there are two functions, F1 and F1_logging. F1 triggers on E1_filtered, logs the event that triggered it, does some business logic, logs the event it generates, then emits that event. For tracing the events through a stream analytics job, we only care about logging the event that triggered F1. Following sections will deal with tracing events across functions. F1_logging will trigger on E1_logging, where it will simply log the incoming event to application insights.
[FunctionName("F1_filtered_trigger")]
public async Task Run(
     [EventHubTrigger("%E1_filtered_EventHubName%", Connection = "E1_filtered_EventHubConnectionString", ConsumerGroup = "E1_filtered_consumers")] EventData[] events,
     [EventHub("%E2_EventHubName%", Connection = "E2_EventHubConnectionString")] IAsyncCollector<string> outputEvents,
     ExecutionContext executionContext,
     ILogger log)
{
     var correlationId = executionContext.InvocationId;
     foreach (EventData eventData in events)
     {
         var messageBody = Encoding.UTF8.GetString(eventData.Body.Array, eventData.Body.Offset, eventData.Body.Count);         log.LogInformation(correlationId.ToString() + ": Parsed event message body {E1_filtered_event}", messageBody);
     }
     // Business logic and code to emit a new event to E2 event hub not relevant to this topic
}
[FunctionName("F1_logged_trigger")] public void Run(
[EventHubTrigger("%E1_logged_EventHubName%", Connection = "E1_logged_EventHubConnectionString", ConsumerGroup = "E1_logged_consumers")] EventData[] events,
ExecutionContext executionContext,
ILogger log)
{
var correlationId = executionContext.InvocationId;
foreach (var eventData in events)
{
var messageBody = Encoding.UTF8.GetString(eventData.Body.Array, eventData.Body.Offset, eventData.Body.Count);
log.LogInformation(correlationId.ToString() + ": Parsed event message body {E1_logged_event}", messageBody);
}
}Application Insights
Lastly, we can make use of the data we’ve logged by connecting the events that branched out to the filtered and logged event hubs. In the Application Insights resource that the Functions Application has been logging to, there is feature in the “logs” section to write queries in the Kusto language that is a mix of SQL commands and piping logic. The following query will join logs where the id of an event sent to the filtered event hub matches the id of an event from the logged event hub:
let AllEvents = traces
| extend loggedMessage = parse_json(tostring(customDimensions.['E1_logged_event']))
| where isnotnull(loggedMessage)
| mv-expand bagexpansion=array loggedMessage
| project loggedMessage
| extend loggedMessageId = tostring(loggedMessage.id)
| extend loggedMessageEventTime = todatetime(loggedMessage.eventTime);
let IngestedEvents = traces
| extend ingestedMessage = parse_json(tostring(customDimensions.['E1_filtered_event']))
| where isnotnull(ingestedMessage)
| mv-expand bagexpansion=array ingestedMessage
| project ingestedMessage
| extend ingestedMessageId = tostring(ingestedMessage.id);
AllEvents
| join kind=leftouter IngestedEvents on $left.loggedMessageId == $right.ingestedMessageId
| order by loggedMessageEventTime desc
This will show all events that were sent, displayed as a column ‘loggedMessage’ and if the event was not filtered out, it will show up as part of the same record as ‘ingestedMessage’. Events that were dropped will have a null entry in that column so it becomes easy to see which events were used and which were not.
Example
Here is a real-world example of the results from the Application Insights query which can be used both for debugging and for metric analysis:

To visualize the data over time, the Application Insights query can be modified like so:
AllEvents
| join kind=leftouter IngestedEvents on $left.loggedMessageId == $right.ingestedMessageId
| order by loggedMessageEventTime desc
| summarize unfilteredEvents=count(), filteredEvents=countif(ingestedMessageId == '') by bin(loggedMessageEventTime, 5m)
| render timechart
Which will produce the following:

Tracing Workflow for Events Between Functions

There is no state that is kept between scoped function requests. Nothing relates one function to the event it sends to the next function and so on. To compound this problem, business logic can require that events collapse or fan out to and from functions. The relationship between such event driven functions is many to many, many to one, one to many, or one to one. It all depends on the specific design of the application. To trace from end to end, it is necessary to store unique ids of events sent from and received by a function. This allows a graph of the entire request to be found. If the graph is simple, meaning no undirected cycles(like a feed-forward network), then the initial event that triggers the request has a finite number of linked requests and will have a definite completion. The following assumes this is the case since if the application has loops that never stop, then the following solution is not guaranteed to work.
First Function
Consider the F1_filtered function again which in this example creates many events from a single function request:
[FunctionName("F1_filtered_trigger")]
public async Task Run(
     [EventHubTrigger("%E1_filtered_EventHubName%", Connection = "E1_filtered_EventHubConnectionString", ConsumerGroup = "E1_filtered_consumers")] EventData[] events,
     [EventHub("%E2_EventHubName%", Connection = "E2_EventHubConnectionString")] IAsyncCollector<string> outputEvents,
     ExecutionContext executionContext,
     ILogger log)
{
     var correlationId = executionContext.InvocationId;
     foreach (EventData eventData in events)
     {
         var messageBody = Encoding.UTF8.GetString(eventData.Body.Array, eventData.Body.Offset, eventData.Body.Count);         log.LogInformation(correlationId.ToString() + ": Parsed event message body {E1_filtered_event}", messageBody);
     }
     // Business logic
     foreach (var item in businessLogicData)
     {
         var outputEvent = JsonSerializer.Serialize(
             new CustomEvent
             {
                 Id = Guid.NewGuid(),
                 Data = item,
             });
         await outputEvents.AddAsync(outputEvent);
         log.LogInformation(correlationId.ToString() + ": Emitted event message body {F1_event_output}", outputEvent);
     }
     await outputEvents.FlushAsync();
}
Streaming Analytics
Next, suppose there is an E2 event hub, an S2 streaming analytics job, and an E2_filtered event hub and finally the F2_filtered function that receives the E2_filtered events.
The streaming analytics job combines multiple input events into one output event, merging the data together in a simple way to demonstrate multiple events from different F1_filtered functions being the input for F2_filtered function. The individual Ids are collected into a list in the outgoing event. The event is as follows:
public class AggregateCustomEvent<T>
{
     public string[] Ids { get; set; }
     public T[] DataArray { get; set; }
}
And the Streaming Analytics Job is:
WITH aggregateQuery AS
(    SELECT COLLECT(Id) AS Ids, COLLECT(Data) AS DataArray
     FROM [asainp-E2]
     GROUP BY TumblingW indow(second, 5)
)
SELECT Ids, DataArray
INTO [asaout-E2_filtered]
FROM aggregateQuery
Second Function
And finally, the F2_filtered function triggered by the AggregateCustomEvents. Besides whatever business logic it does, it will log the events it receives like so:
[FunctionName("F2_filtered_trigger")]
public void Run(
     [EventHubTrigger("%E2_filtered_EventHubName%", Connection = "E2_filtered_EventHubConnectionString", ConsumerGroup = "E2_filtered_consumers")] EventData[] events,
     ExecutionContext executionContext,
     ILogger log)
{
    var correlationId = executionContext.InvocationId;
    foreach (var eventData in events)
     {
         var messageBody = Encoding.UTF8.GetString(eventData.Body.Array, eventData.Body.Offset, eventData.Body.Count);         log.LogInformation(correlationId.ToString() + ": Parsed event message body {E2_filtered_event}", messageBody);
     }
}
Application Insights
Now we have all the logging we need to relate F1_filtered functions by event Ids to F2_filtered functions by those same event Ids. Here is the Application Insights query to do that:
let F1Requests = traces
| extend F1Event = parse_json(tostring(customDimensions.['F1_event_output']))
| where isnotnull(F1Event)
| project InvocationId=customDimensions.['InvocationId'], F1EventIds=F1Event.Id
| summarize F1EventIds by InvocationId
let F2Requests = traces
| extend F2Event = parse_json(tostring(customDimensions.['E2_filtered_event']))
| where isnotnull(F2Event)
| mv-expand bagexpansion=array F2EventIds=F2Event.Ids
| project InvocationId=customDimensions.['InvocationId'], F2EventIds
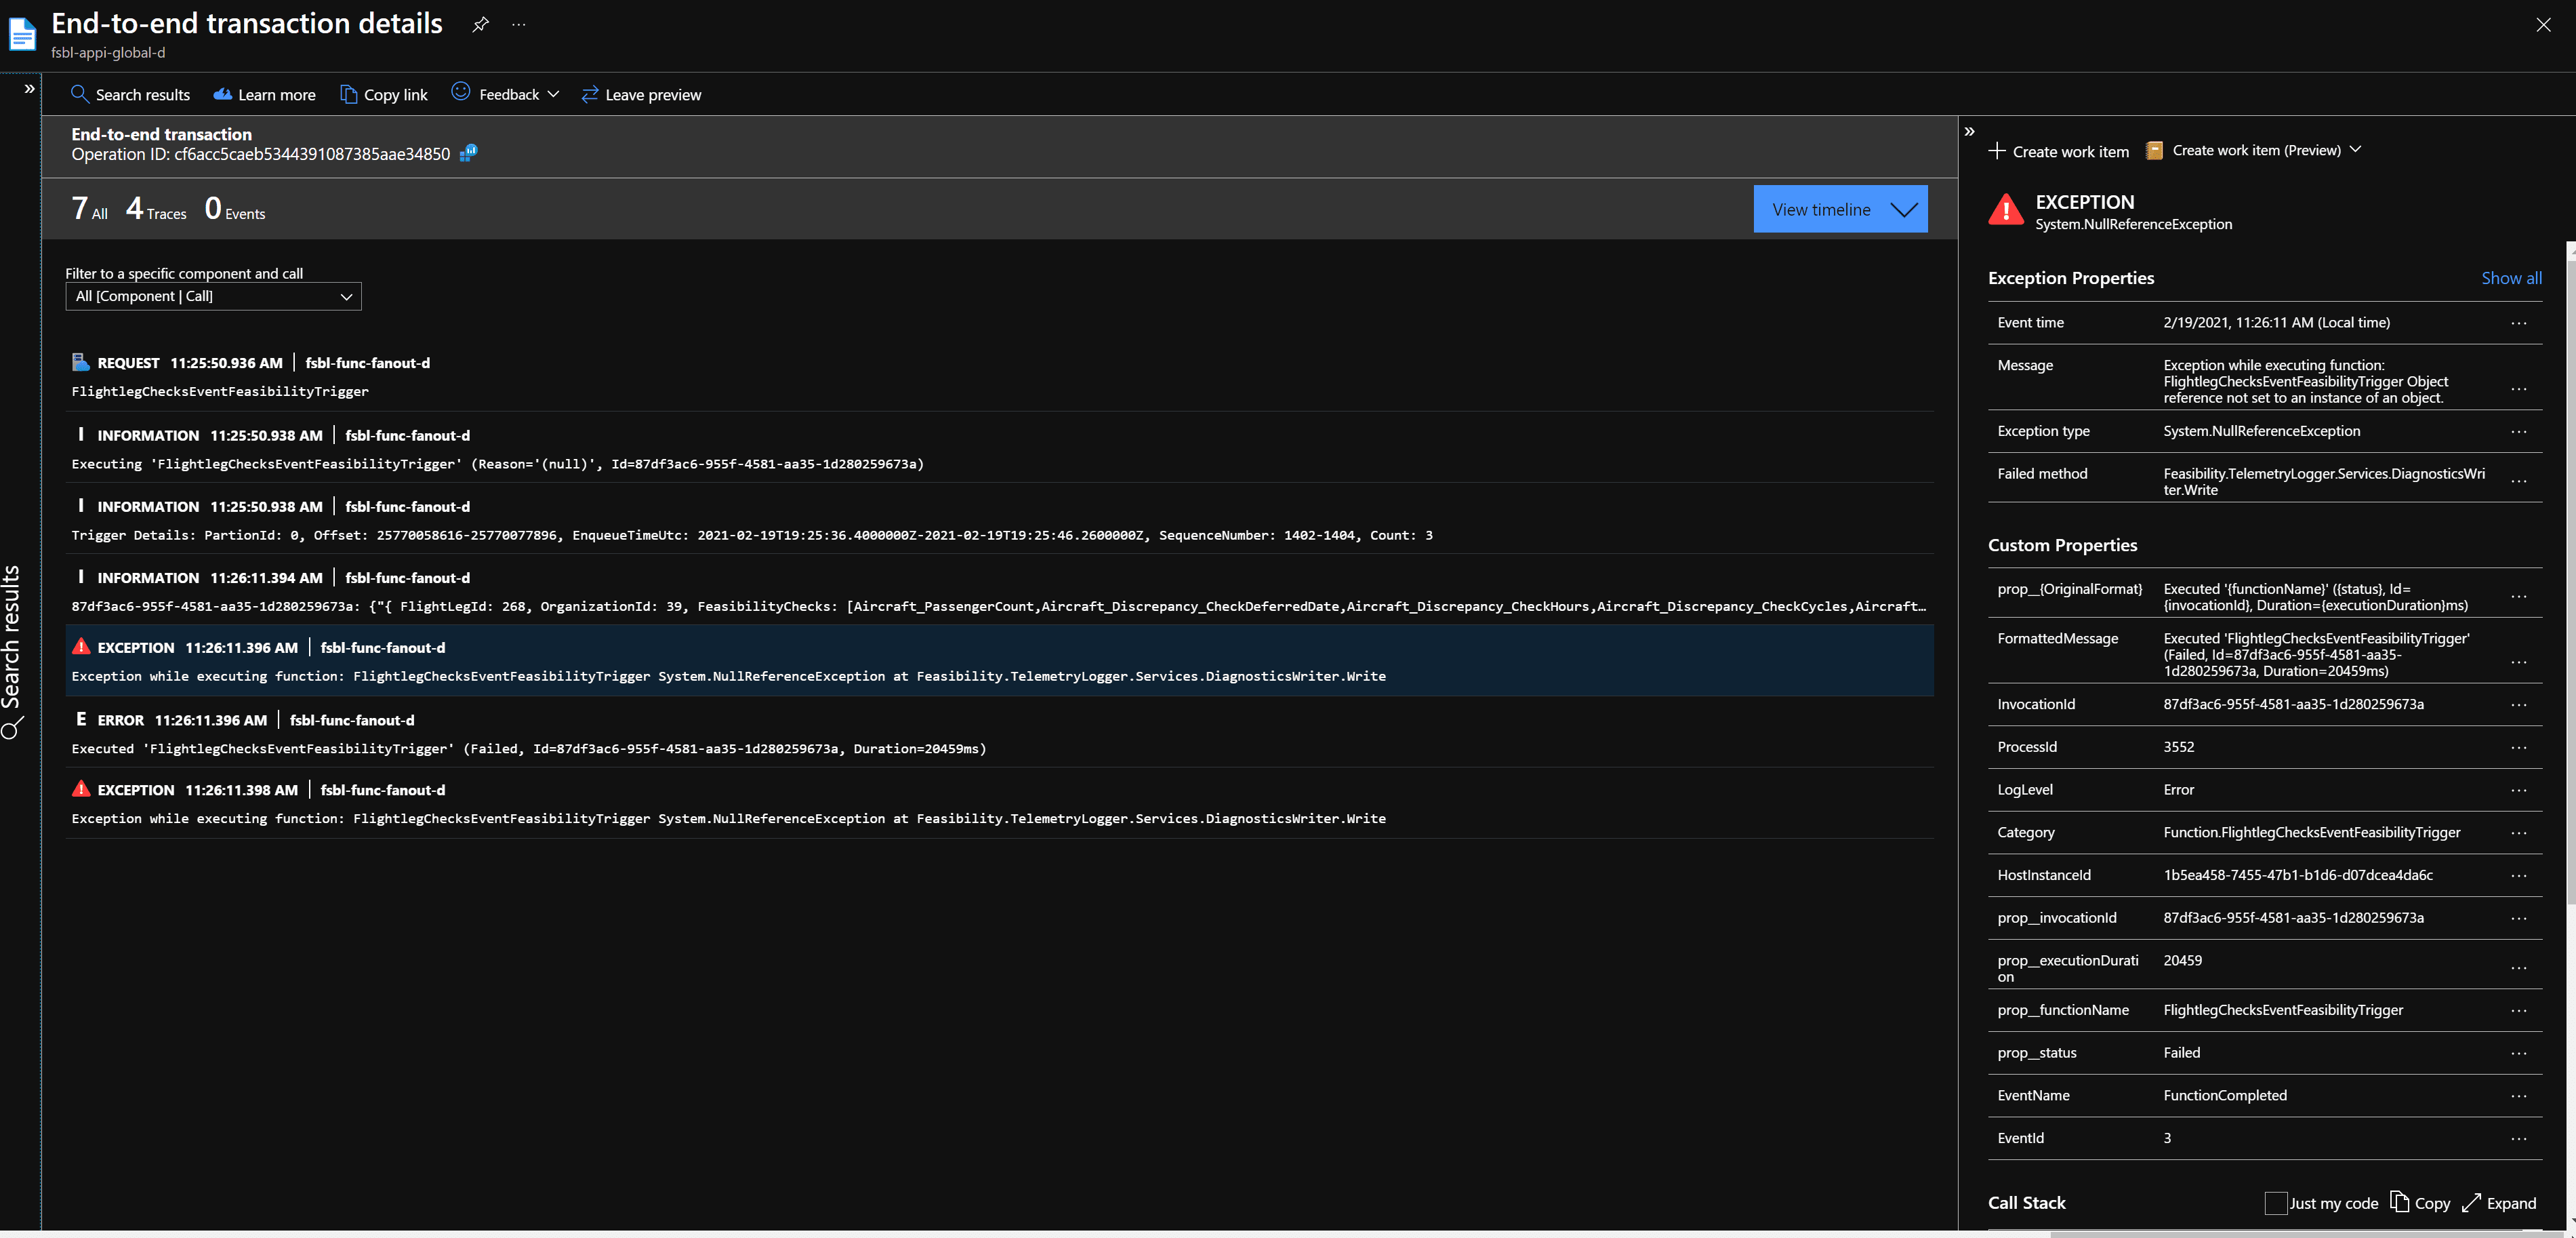
| summarize F2EventIds by InvocationIdYou can use these as building blocks for anything you wish to do with the data. Each record will be a function request(by invocationId) with all of the relevant event Ids for that request as an array. You can then pick a particular request for F1 and see all of the F2 requests that contain event Ids that came from it. The details of the exceptions from the logs can then be used as parameters for additional queries built on the query definitions above, making use of Azure’s own exception logging found from the functions resource application map:
Summary
With the above steps, we hope you’re able to achieve traceability in your serverless Azure architecture. It’s a complex problem and each situation is unique but by following these steps, you should be well on your way. If you’re struggling to implement or have questions, we can help. Contact us today.

ABOUT THE AUTHOR: Brad Sherard
Brad is a Senior Consultant who has worked in many roles including QA, Test Automation, Software Engineer, Engineering Lead, and Engineering Manager. He is a full-stack developer with experience primarily in .NET technologies, ranging from WPF and UWP on the front end to ASP and NoSQL Server on the back end. He also has experience with supplemental technologies from Azure, such as no-sql table storage, application insights, and others. Brad has specializations in full-stack development with an emphasis on technical research and investigations. In his spare time, he enjoys reading, finding new music, and building physics simulations.