
AIM Consultant Tricia Duncan recently had the opportunity to speak at MinneFRAMA, an annual finance, retail and marketing analytics conference organized by MinneAnalytics, a local analytics group that hosts monthly meetings and quarterly conferences. Over 800 technology and business professionals attended the event to network and listen to a variety of presentations on emerging data science and analytics trends. The Governor of Minnesota, Mark Dayton, was also in attendance. One interesting technology that was discussed was robotic process automation (RPA) and how it is being used to generate new levels of business processes and analytics optimization.
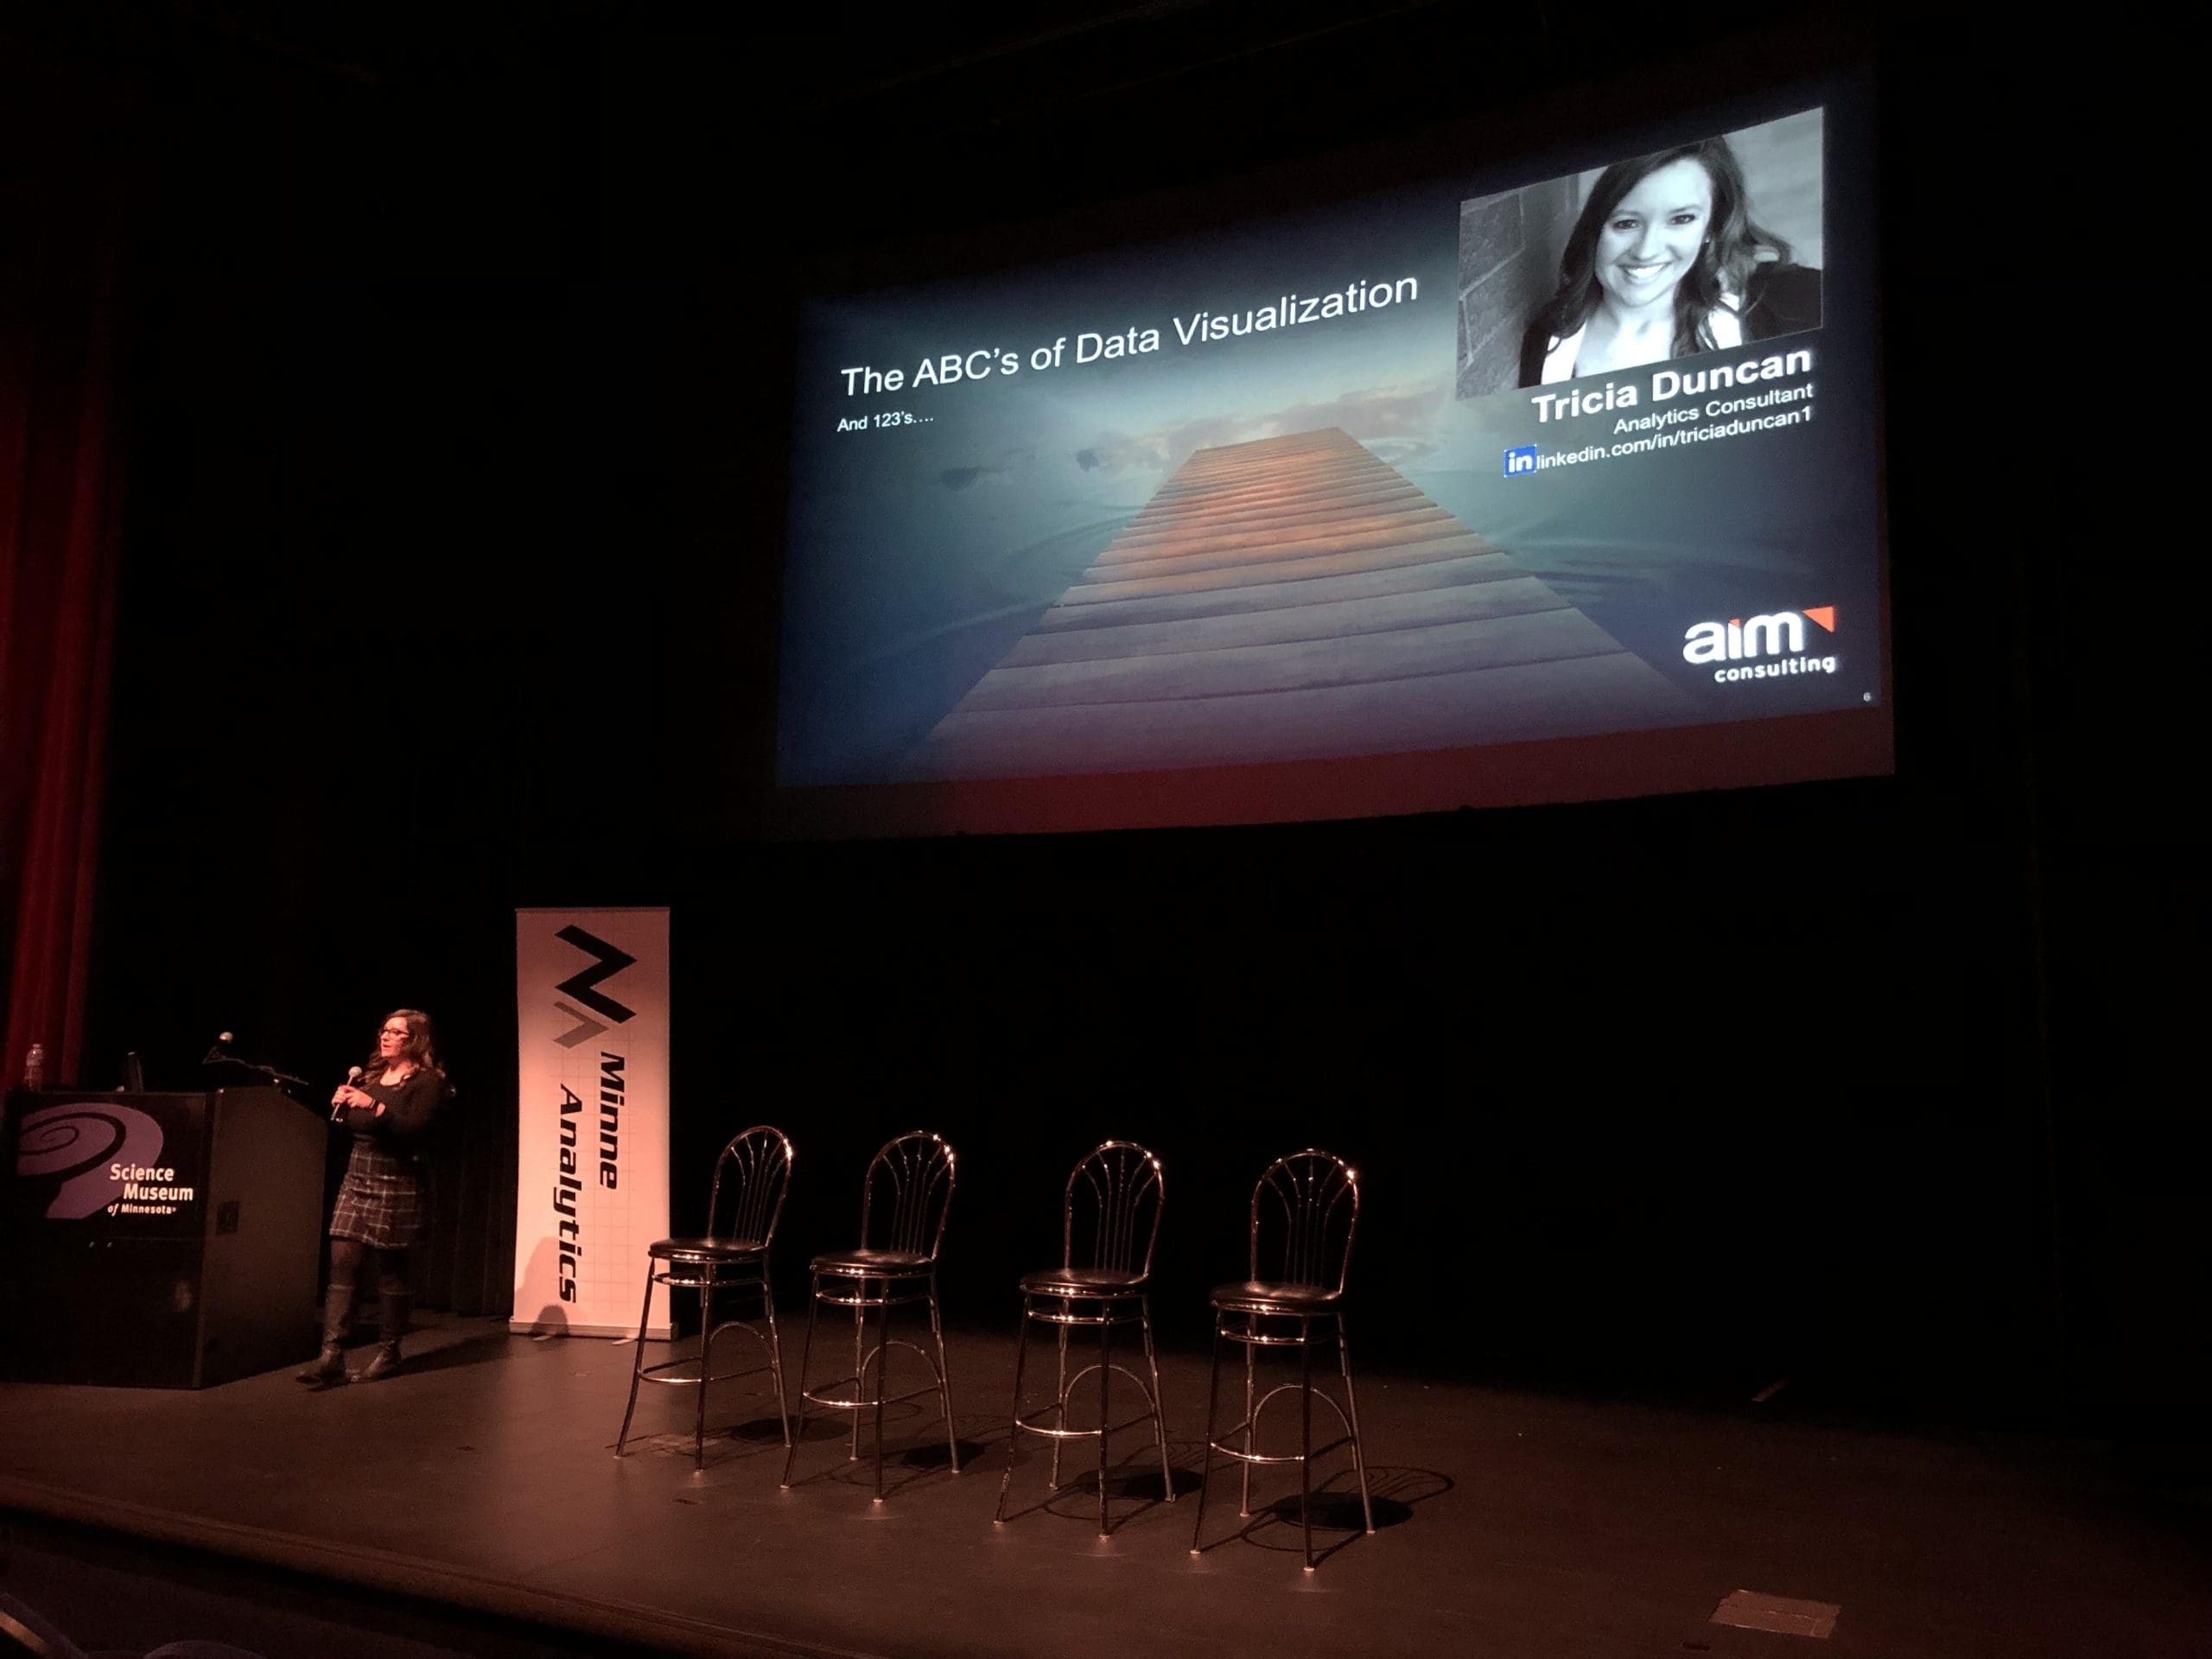
Tricia’s speech focused on the ABC’s of Data Visualization (Audience, Best Practices, and Content) and how to make visualizations more compelling. In particular, she offered the following advice:
- Remember your audience
- Focus on their requirements
- Ask “What decisions are making off of these visualizations?”
- Use terminology that is familiar
- Apply data visualization best practices
- Know what your BI tool can do for you
- Don’t abuse the power
- Provide clear content
- What are you presenting is as important as who are showing it to
- Define axes when necessary
- Design iteratively
- Use color properly
If you would like to see all the presentation decks from the MinneFRAMA conference, click here.
About MinneAnalytics
MinneAnalytics is a nonprofit organization dedicated to serving the data science and analytics community in Minnesota, the Upper Midwest, and beyond by providing accessible, authentic and engaging events. We facilitate the sharing of knowledge and ideas among analytics professionals across business, technology and decision science through our industry-specific conferences and educational events.
About Twin Cities Data Visualization Group
The Twin Cities Data Visualization Group focuses on creating a community around visually telling stories through data and technology mediums. The group arose through the desire of a handful of people who wanted to discuss visualization across sectors such as non-profits, journalism, arts, academia, and the private sector. We welcome everyone; those whom likely work with visualization technologies, interact closely with people who do, support individuals who do and are interested in getting started on their own data visualization journey.